Shared Micromobility
State of the Industry Reports
NABSA produces the annual Shared Micromobility State of the Industry Report - the only report of its kind for North America. This page summarizes shared micromobility's trends and successes for the most recent year and includes links to previous reports.
2024 Shared Micromobility
State of the Industry Report
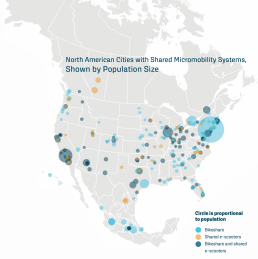
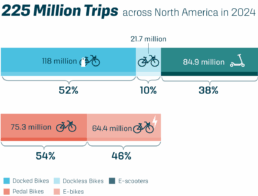
On August 7th, NABSA released the sixth annual Shared Micromobility State of the Industry Report for North America. The 2024 State of the Industry Report shows that shared micromobility ridership is thriving, showing that it is both a service that works for people to get where they need to go, and is also valued by communities of all sizes across North America. In 2024, at least 225 million shared micromobility trips were taken in 415 cities across North America.
Growth and Evolution
In 2024, the industry continued to evolve and grow, with another year of record-breaking ridership and a substantial 31% increase in trip-making compared to 2023. That robust growth spans cities and towns across North America, proving that shared micromobility works, and communities value it. With the industry now firmly established, aligning public funding and policy support with its growing scale and success is key to sustainable operations.

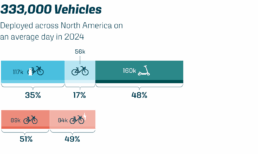
Shared Micromobility in North America
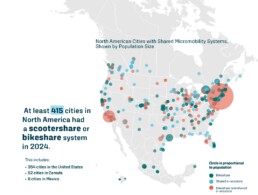
*The word cities is used to denote local jurisdictions or municipalities throughout this report. On occasion, the word cities is used as a catch-all that may include metro regions or counties in which shared micromobility systems operate; when this happens, the geography will be specified in the text and/or the methodology section.
Shared Micromobility as Public Transportation
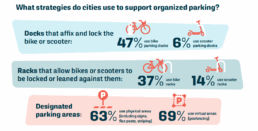
Parking Management
Effective parking management is essential for shared micromobility to maintain sidewalk accessibility, reduce clutter, and support safe, reliable use of public space.

Public Agency Support for Shared Micromobility
Public agency staff time or funding can support system sustainability and longevity.
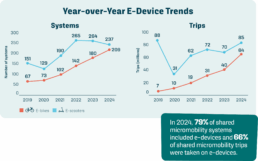
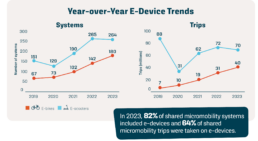
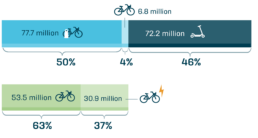
Electrification Trends
Electrification trends continue to grow, as electrified shared micromobility fleets gain in popularity and usage.

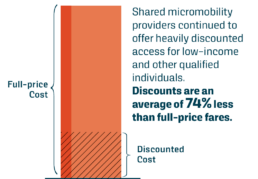
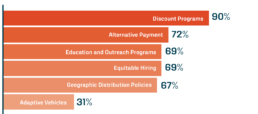
Transportation Equity
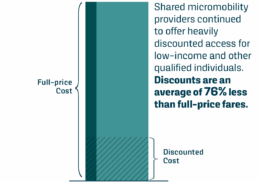
Shared micromobility systems continue to provide a range of programs to advance equity.
How NABSA Supports the Industry
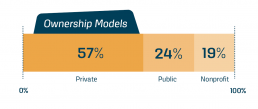
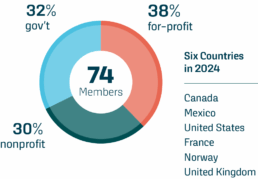
The North American Bikeshare & Scootershare Association (NABSA) collaborates across sectors to grow shared micromobility and its benefits to communities, creating a more equitable and sustainable transportation ecosystem. NABSA is a nonprofit organization dedicated to providing resources, education, and advocacy for the shared micromobility industry, and to creating spaces for the industry’s public, private, and nonprofit sectors to convene and empower each other. In 2024, NABSA had 74 members from six countries.
Find out so much more in the full 2024 report!
Previous State of the Industry Reports
State of the Industry: 2023
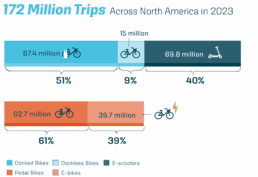
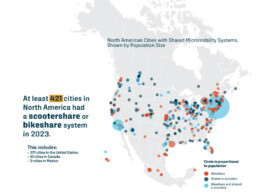
On August 6th, NABSA released the fifth annual Shared Micromobility State of the Industry Report for North America. The 2023 State of the Industry Report demonstrates shared micromobility’s continued viability and strength as an important mode in the public transportation ecosystem, and shows an industry that continues to grow, mature, electrify, and gain efficiencies and effectiveness. In 2023, at least 172 million shared micromobility trips were taken in 421 cities across North America.
Evolution and Maturity
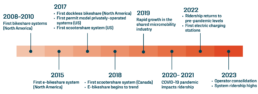
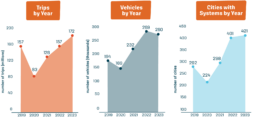
Over the last fifteen years, shared micromobility has grown, evolved, and strengthened as an industry. Shared micromobility trips and the number of cities with shared micromobility systems are at the highest levels to date.
Shared Micromobility in North America
Electrification Trends
Electrified shared micromobility fleets are growing in popularity and usage.
State of the Industry: 2022
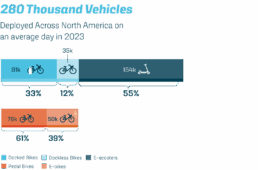
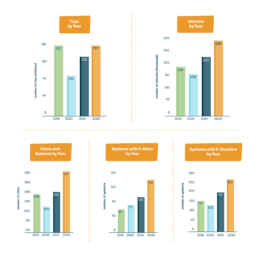
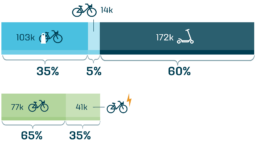
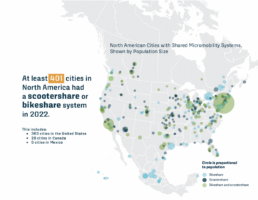
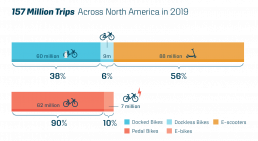
On August 10th, NABSA released the fourth annual Shared Micromobility State of the Industry Report for North America. The 2022 State of the Industry Report shows that shared micromobility ridership across North America returned to pre-pandemic levels in 2022, and reached the highest number of cities with systems across North America yet. In 2022, at least 157 million shared micromobility trips were taken in 401 cities across North America. Systems are expanding as well, with the highest number of deployed shared micromobilty vehicles to date– 289,000.
Resilience and Growth
In 2022, trip-making re-established itself to pre-pandemic levels, and there was a rapid increase in the number of cities with shared micromobility. The ecosystem of shared micromobility vehicles continued to evolve, with e-devices (e-scooters and e-bikes) growing in usage and popularity.
Shared Micromobility in North America
Electrification Trends
Electrified shared micromobility fleets are growing in popularity and usage.
State of the Industry: 2021
On August 3rd 2022, NABSA released the third annual Shared Micromobility State of the Industry Report for North America. The 2021 report tells the second half of the COVID-19 story and further demonstrates the resilience, importance, and demand for shared micromobility. Some of the metrics in the report include country-by-country breakdowns of ridership and vehicle types, physical activity gained, greenhouse gas offset, mode shift, rider representation, economic impacts, and much more. New additions to the 2021 State of the Industry report include a section outlining shared micromobility in policy, case studies, and an expanded transit integration section.
COVID-19 Pandemic Resilience
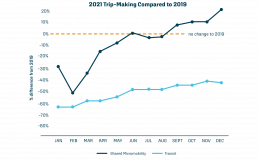
Shared micromobility continued to show remarkable resilience and rebound from the impacts of the pandemic in 2021. The number of systems and vehicles was above 2019 levels, and while total trip numbers were below 2019 numbers, monthly ridership started to surpass 2019 levels towards the middle of 2021.
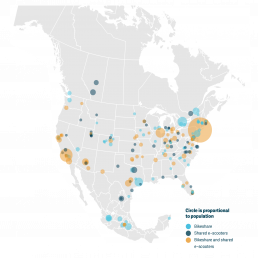
In 2021, at least 298 cities* had at least one bikeshare or e-scooter system and 97 had both.
This includes:
- 273 cities in the United States
- 19 cities in Mexico
- 6 cities in Canada
*The word cities is used to denote local jurisdictions or municipalities throughout this report. On occasion, the word cities is used as a catch-all that may include metro regions or counties in which shared micromobility systems operate; when this happens, the geography will be specified in the text and/or the methodology section.
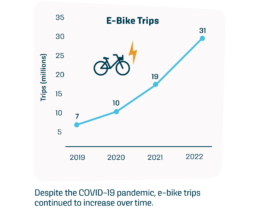
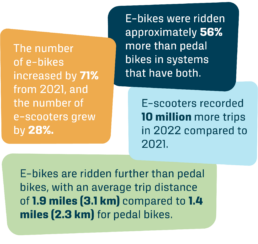
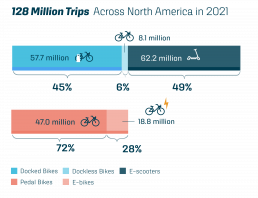
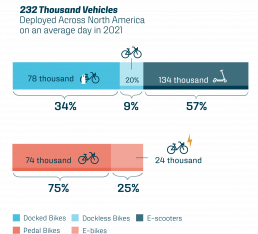
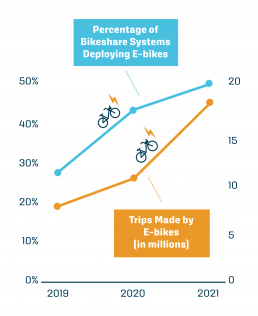
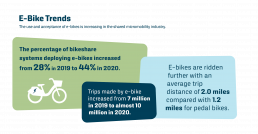
E-bikes were ridden approximately 36% more than regular pedal bikes.
The use and popularity of e-bikes is increasing in the shared micromobility industry.

State of the Industry: 2020
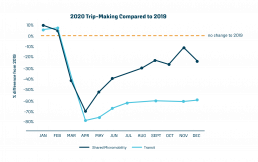
On August 5th, 2020, NABSA released the second annual Shared Micromobility State of the Industry Report for North America. The 2020 report quantifies the impact of the COVID-19 pandemic on shared micromobility and demonstrates the industry’s response and resilience during this time to provide essential mobility services. The report also compares trends from 2019 and presents new research that shows the industry’s impact in North America.
COVID-19 Response and Resilience
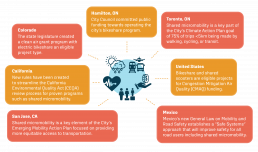
2020 was a tough year for everyone, but the shared micromobility industry proved its resilience and played an important part in keeping North America moving by providing programs and services where it was most needed.
- 65% of operators provided free or discounted rides to essential workers
- About 50% of shared micromobility operators reported an increase in first-time riders

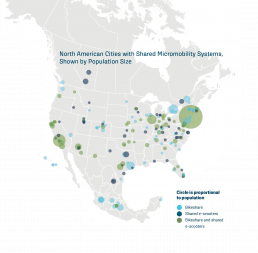
In 2020, at least 224 cities* had at least one bikeshare or e-scooter system and 72 had both.
This includes:
- 203 cities in the United States
- 14 cities in Mexico
- 7 cities in Canada
*The word cities is used to denote local jurisdictions or municipalities throughout this report. On occasion, the word cities is used as a catch-all that may include metro regions or counties in which shared micromobility systems operate; when this happens, the geography will be specified in the text and/or the methodology section.

State of the Industry: 2019
Over the last 14 years, the shared micromobility industry has grown from a handful of city bikeshare programs, to a complex ecosystem of bikeshare and shared e-scooter systems with a wide variety of vehicle types, system models, and ownership configurations. Cities have come to rely on shared micromobility as an integral part of the transportation network, increasing transportation options and contributing to environmental, equity, and public health goals.
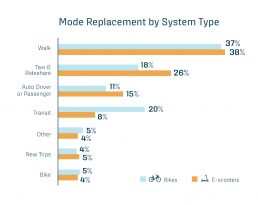
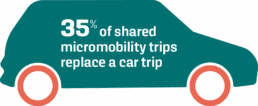
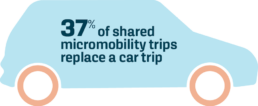
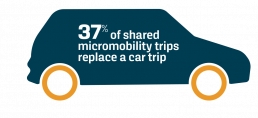
36% of shared micromobility trips replace a car trip.
User surveys show that shared micromobility in place of a wide variety of modes, and that 5% of trips are new trips that wouldn't have been taken otherwise.
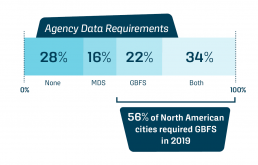
In 2019, at least 292 cities had at least one bikeshare or e-scooter system and 99 had both.
This includes:
- 264 cities in the United States
- 17 cities in Mexico
- 11 cities in Canada
*The word cities is used to denote local jurisdictions or municipalities throughout this report. On occasion, the word cities is used as a catch-all that may include metro regions or counties in which shared micromobility systems operate; when this happens, the geography will be specified in the text and/or the methodology section.